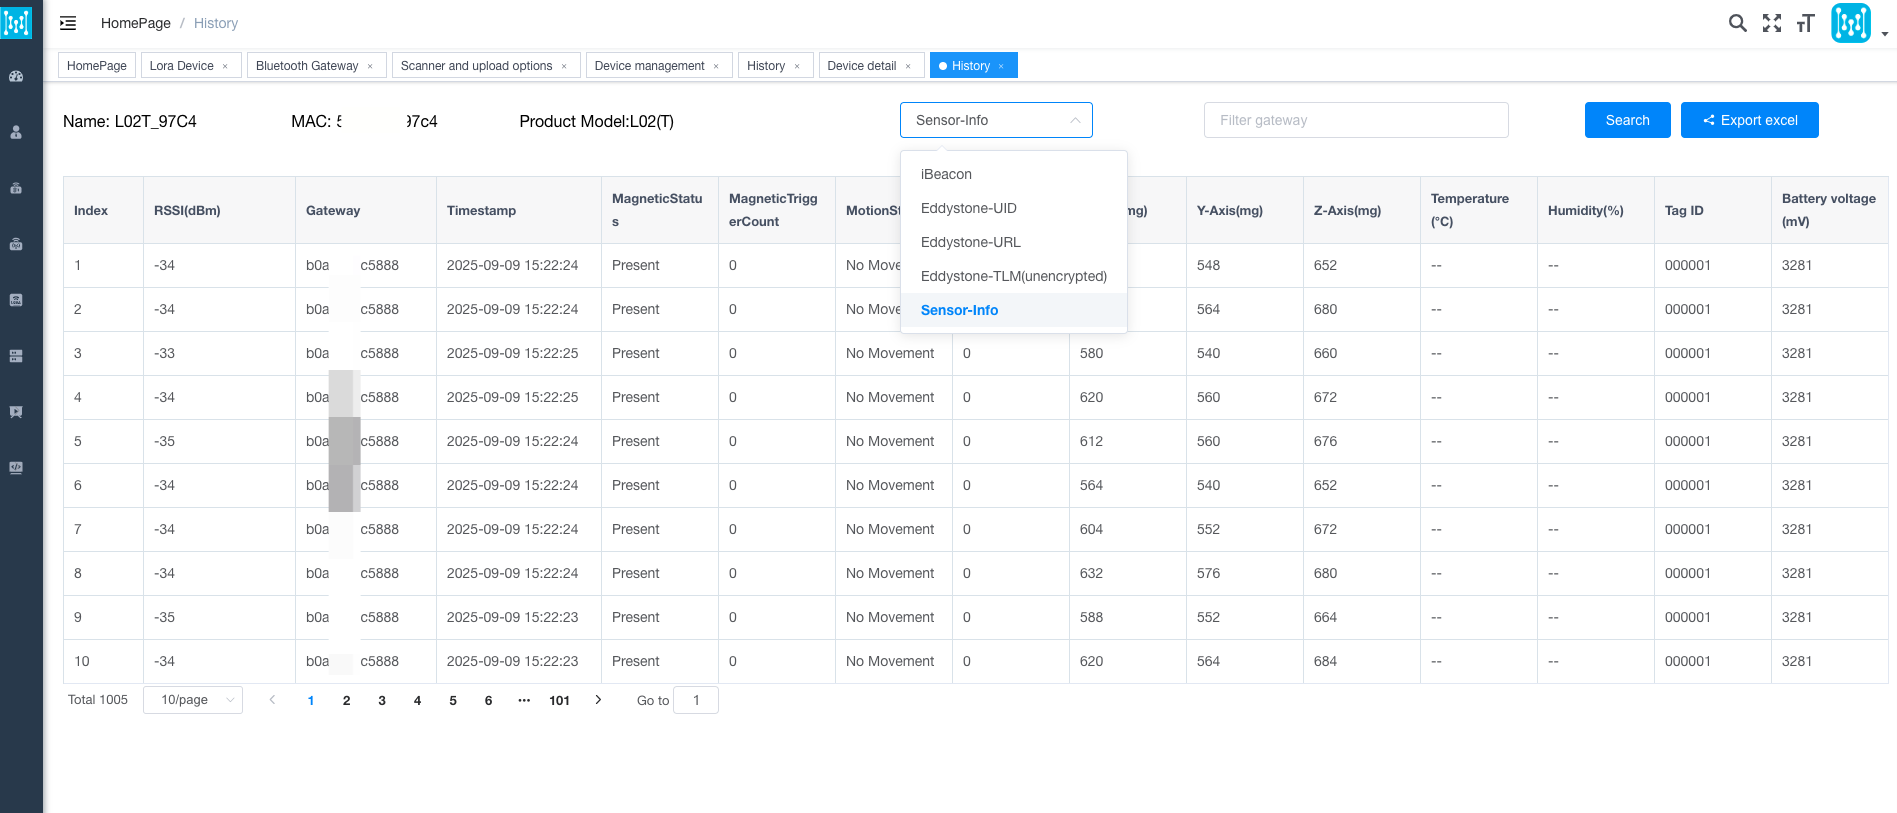
Click the “History” button to view all the data reported by the device after being scanned by the gateway. If it is a device broadcasting multiple frequency bands, you can view it by switching the frame type.
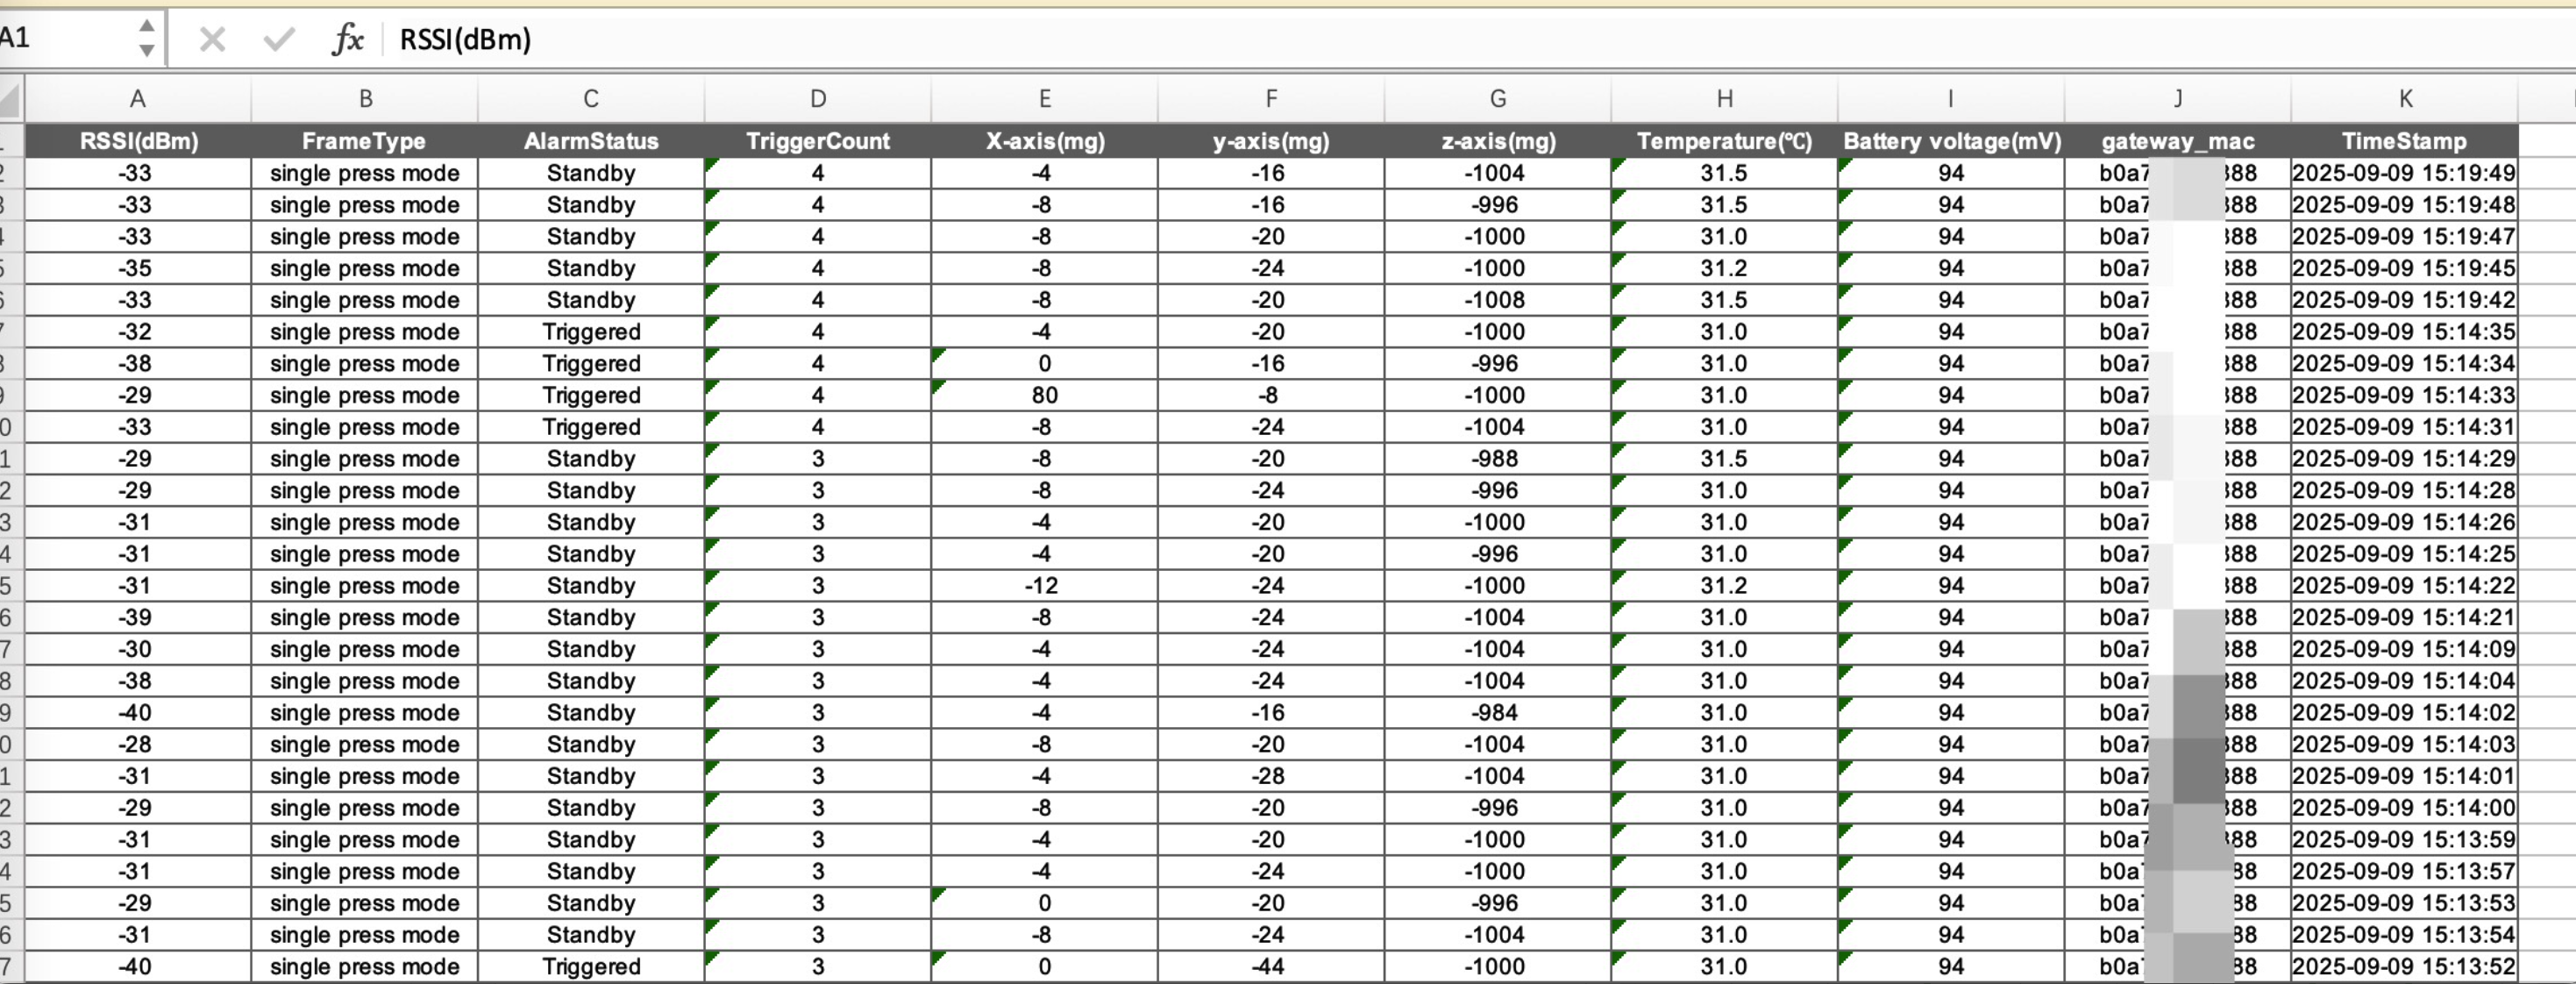
Supports export as an Excel file for convenient data analysis
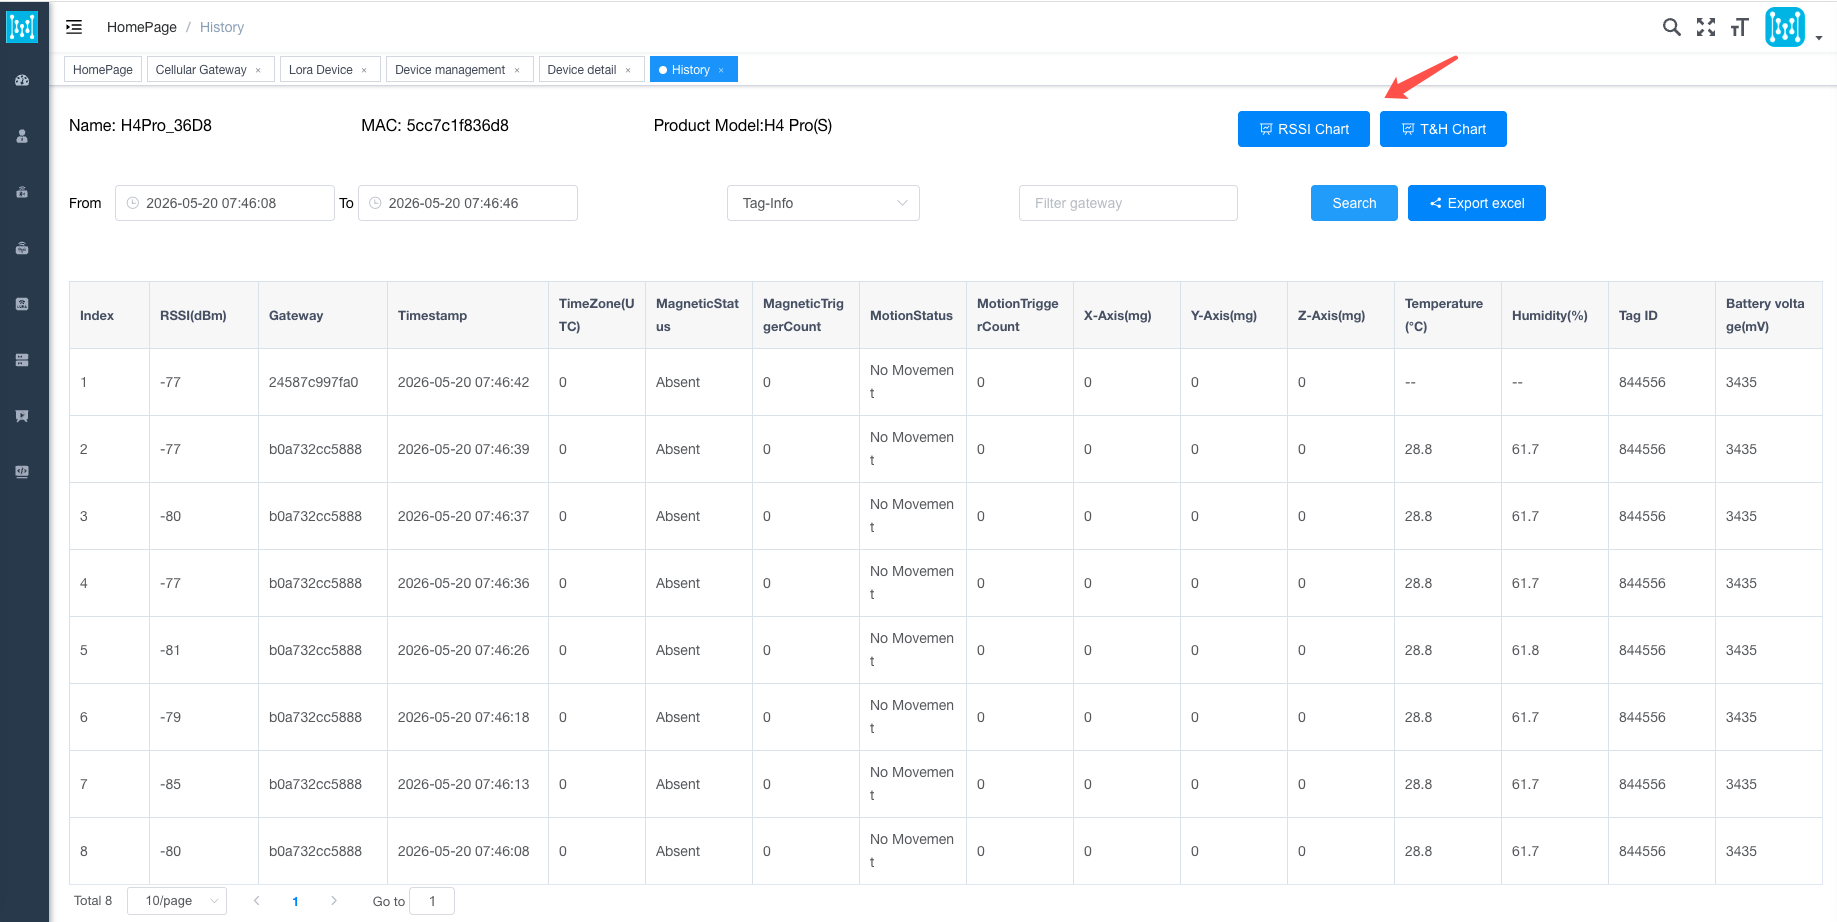
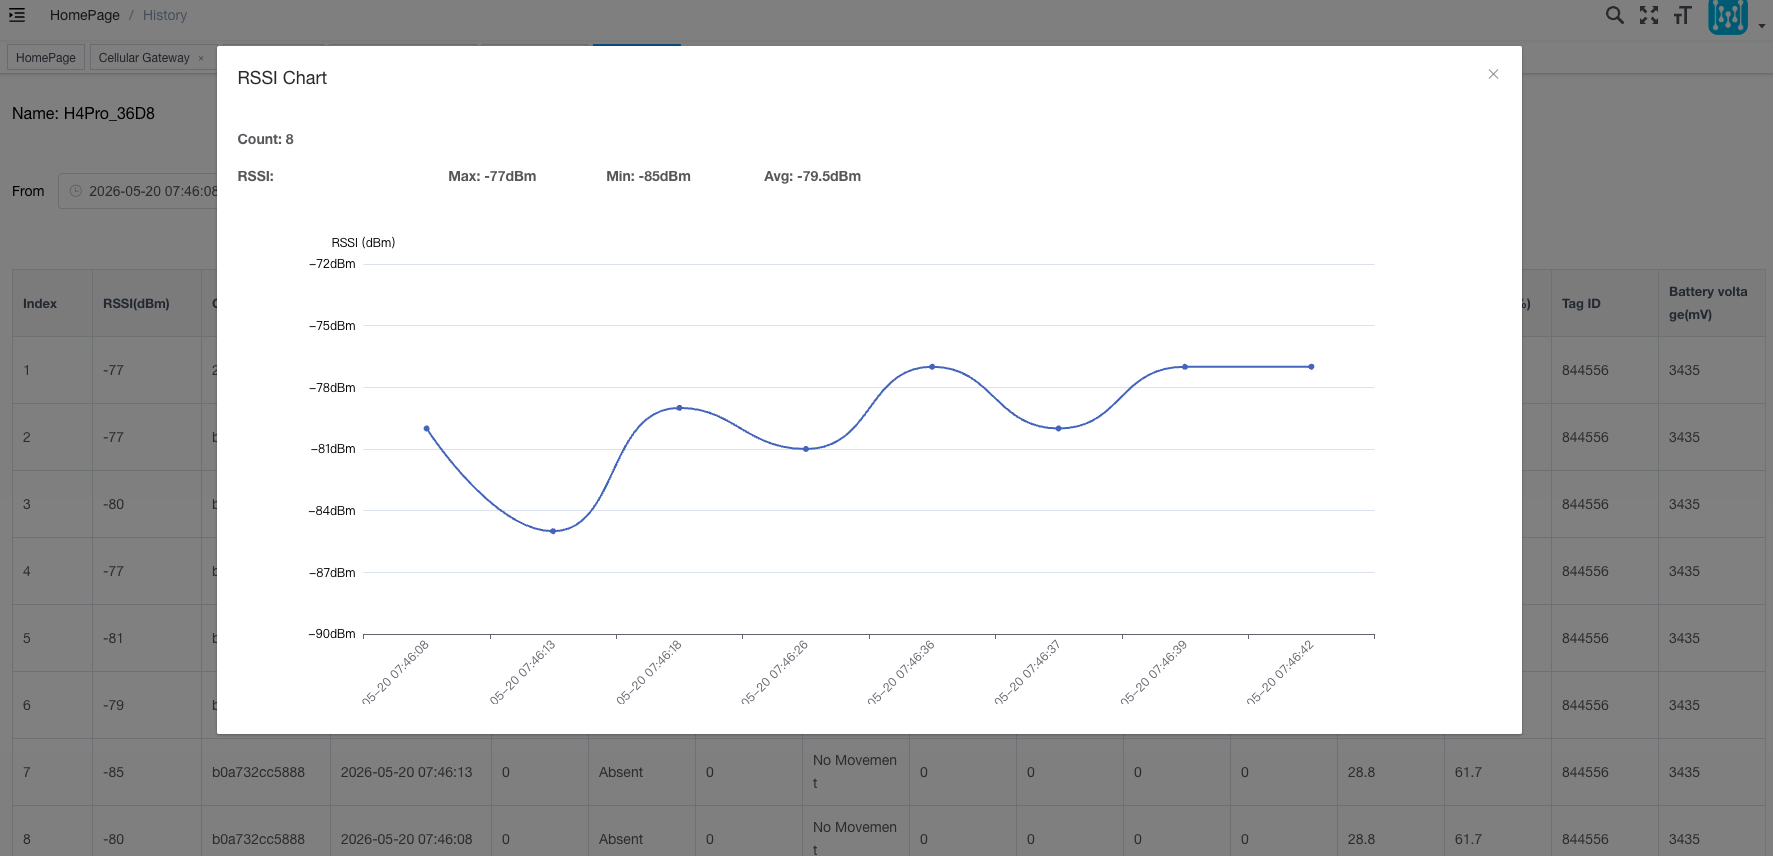
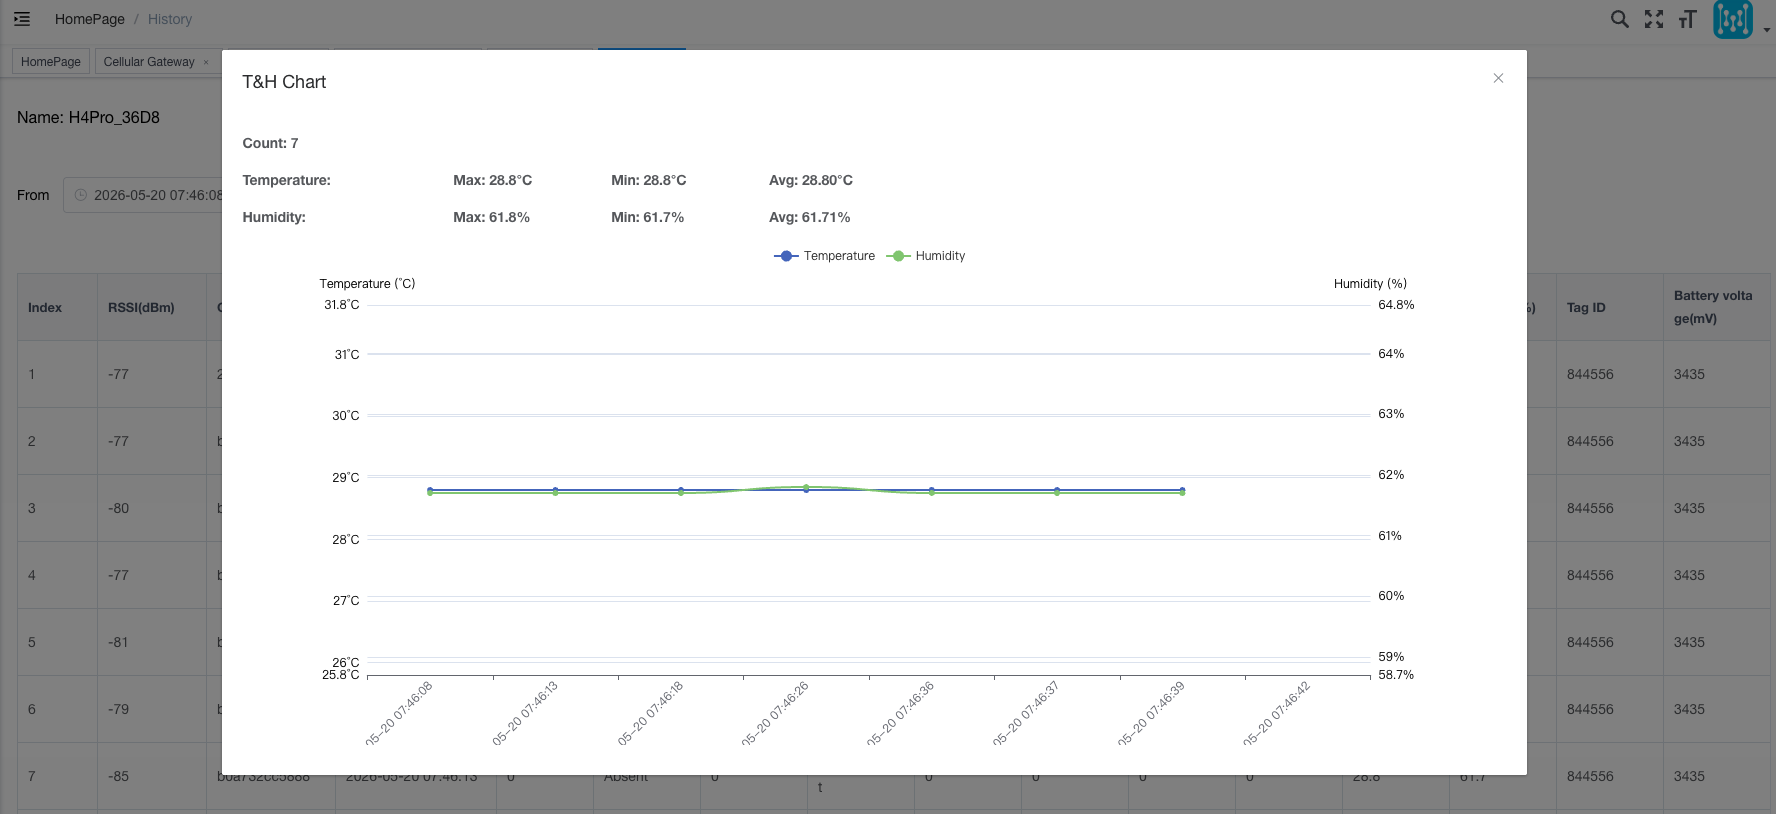
If the device is equipped with a temperature and humidity sensor, you can view the temperature and humidity curves over a certain period of time. Other devices can view the RSSI curves.
Author:admin Create time:2025-09-04 11:57
Last editor:admin Update time:2026-06-12 09:12
Last editor:admin Update time:2026-06-12 09:12